As I sit here waiting for my 29-MB file to download, I ponder the origin of this fascination with data that we have developed. As 21st century adults, we are toned and primed to present data, have data-driven conversations and cite data as evidence. How did data gain the power it has over modern society? When and how did we start trusting it more than our own 5 senses?
The answer: storage and accessibility. We have come to a place where we trust and value data in our everyday lives because of how easy it has become to store and access. When we are curious about something, we quickly “google it” rather than drive down to the nearest library to look it up.
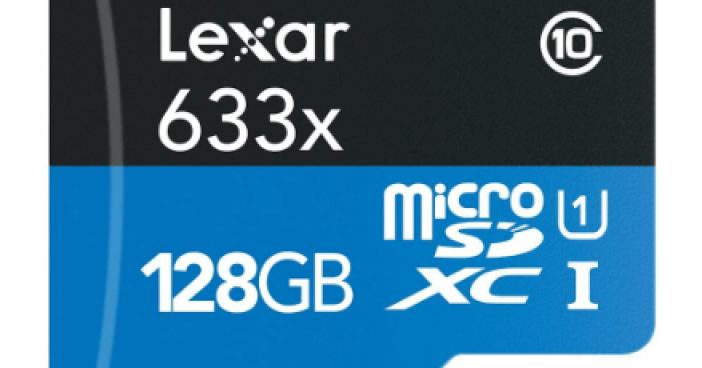
Growth in the field of data storage has influenced and facilitated the ability to store various files, which is a main qualifier for data visualizations and analytics. If data existed in manual punched cards, as it did throughout the 20th century, we wouldn’t be able to access it quite the way we do now. In the 1890’s, when punched cards were first used for statistics tabulation by the New York City Board of Health, they didn’t have the power of modern data storage devices to encompass all the data in one place with easy accessibility. In fact, they had to store data in cardboard boxes that filled aisles and aisles in warehouses. Thanks to leaps in modern technology and the dawn of the digital age, we have swiftly made a move out of paper data storage into the microSD cards and nanoSD cards which are able to easily store 100 GB+ in memory.
This revolution paved the way for the abundance of available data, as well as the development of visualizations that complemented statistics. It is because of reliable and efficient data storage that, without any obstacles, I am loading a file with over 10,000 data points to visualize. We are able to store multidimensional data, which yield richer multidimensional visualizations that tell stories rather than present snapshots. For this reason, a scientist can trust the collective story that thousands of empirical data points can tell over our human observations (which are limited by many factors, including our own brain’s storage capacity).
With ever-evolving technology and an increasingly faster ability to adapt to new technology, I am eager to see how the horizon of data storage further expands and what impact it will have on data visualizations. The door is open for data visualization pioneers to filter, dashboard, slice and dice rich data into meaningful knowledge.
ADEC ESG fully integrates consulting and software with world-class expertise in data collection, processing and management, so you receive comprehensive solutions that meet your unique needs. For more information, contact our team today.


